11.1 The Graph Editor
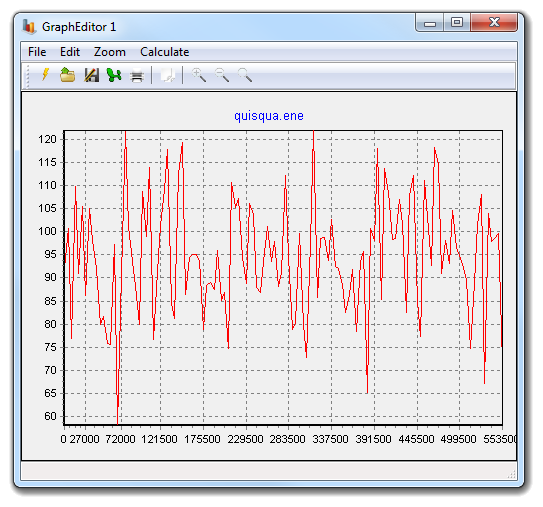
The Graph Editor allows to show and manage data
sets calculated by VEGA ZZ and/or by other external programs. It's possible to load data
in some different file formats in order to support the largest number of software packages. All functions are
accessible through the menu bar, tool bar and mouse. More than one Graph Editors can
be opened selecting Tools
![]() GraphED main menu item or clicking the
graph icon of the VEGA ZZ tool bar.
GraphED main menu item or clicking the
graph icon of the VEGA ZZ tool bar.
11.1.1 File menu
| Item | Accelerator | Description |
| New | Ctrl+N | Clean all data. |
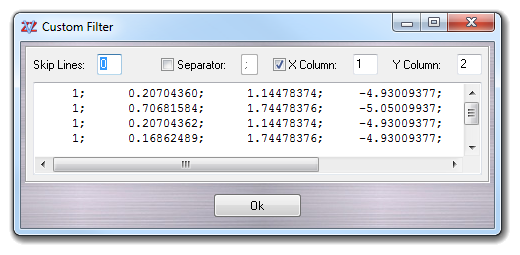
| Open | Ctrl+O | Open a new data set. The same operation can be performed by drag & drop operations of files on the Graph Edtor window. The supported file formats are: CHARMM .ene, Comma Separated values .csv, Data Interchange Format .dif, NAMD output .out, Quanta .plt and Custom. Use the Autodetect function of the file requester to activate the automatic recognition system. If your data set format is not supported, but is ASCII, you can select the Custom filter, that shows the following dialog window:
The central box shows the first lines of the selected file. In the Skip Lines field, you can specify the number of lines that will be skipped starting from the beginning of file. Checking the Separator checkbox, you can insert the character used as column separator. The X Column field, if checked, allows to indicate the column number to associate with the X values and Y Column filed allows to indicate the column number to associate with Y values. Clicking Ok button, you confirm the loading operation. |
| Save As ... | Ctrl+S | Save the data set. The supported output formats are: Comma Separated Values .csv, Data Interchange Format .dif, and Quanta .plt |
| Export to Excel | Ctrl+E |
Export the data directly to Microsoft Excel by OLE interface. Excel must be installed on the PC. |
| Ctrl+P | Print the chart, showing the printer requester. | |
| Exit | - | Close the window without saving. |
11.1.2 Edit menu
| Item | Subitem | Accelerator | Description |
| Labels | Title | - | Change the chart title. |
| X axis | - | Change the X axis label. | |
| Y axis | - | Change the Y axis label. | |
| Copy | Ctrl+C | Copy the selected graph to the clipboard as windows metafile. | |
| Sel. conformation | Ctrl+F | Select the conformation associated to the plot clicking on the trace area. The conformation will be changed automatically and shown in the main window. This item is disabled if the graph isn't generated from the trajectory analysis. |
11.1.3 Zoom menu
| Item | Accelerator | Description |
| In | - | Zoom in. |
| Out | - | Zoom out. |
| Reset | - | Reset to the original scale. |
| Animation | - | If checked (default), activates the zoom animation. |
Please note that to zoom-in on the graph area you can use the mouse pressing the left button and drawing a box.
11.1.4 Calculate menu
| Item | Subitem | Accelerator | Description |
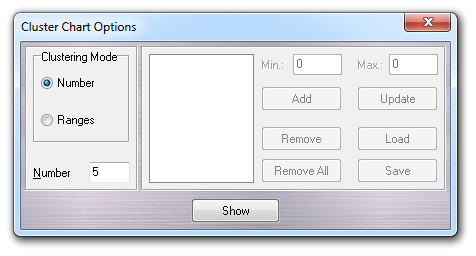
| Cluster Chart | - | Open the cluster analysis dialog:
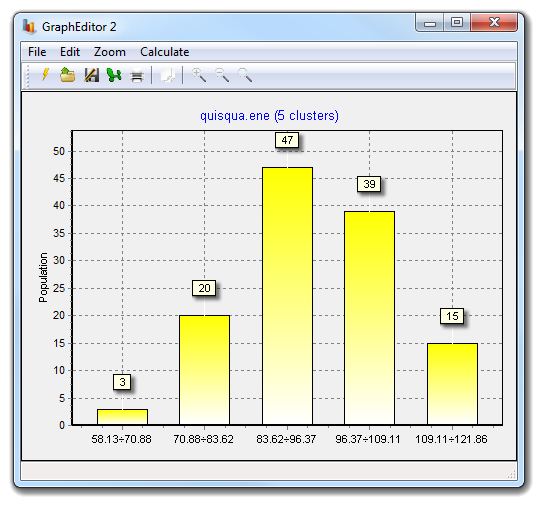
11.1.4.1 Clustering Mode: Number selecting Number from Clustering Mode radiobox, it's possible to specify the number of clusters. The default number of clusters is 5 and the range of each cluster is automatically calculated. Clicking Show, the histogram graph is shown:
Each histogram is a cluster and its height is the number of value contained in the cluster, like shown in the little box on the top.
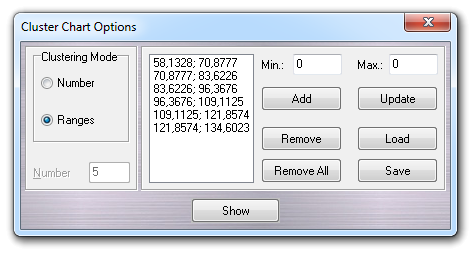
11.1.4.2 Clustering Mode: Ranges This operation mode consists in a user defined list of rages. Each range is the upper and lower limit of a cluster.
You can define a new range (cluster) typing in
Min
and Max fields the limits and pressing the
Add
button. To remove a single range, you must highlight it clicking on the list, and press
the Remove button. If you want remove all ranges, click on
Remove All and if you want change a range, highlight it, type the new limits and
press Update. 0; 30 |
|
| Freq. spectrum | - |
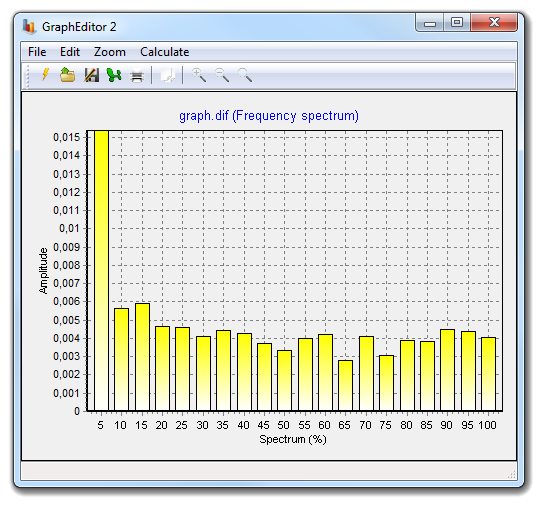
Calculate the DFT (Discrete Fourier Transformation) frequency spectrum. It's useful to highlight the most significant wave components and their frequency and amplitude:
The frequency spectrum is indicated in percent. Please remember that the Shannon's sampling theorem says that maximum frequency in the spectrum (100%) is half the sampling rate. The Amplitude has got the same measure unit of the starting wave. |
|
| Noise reduction | 95 | - |
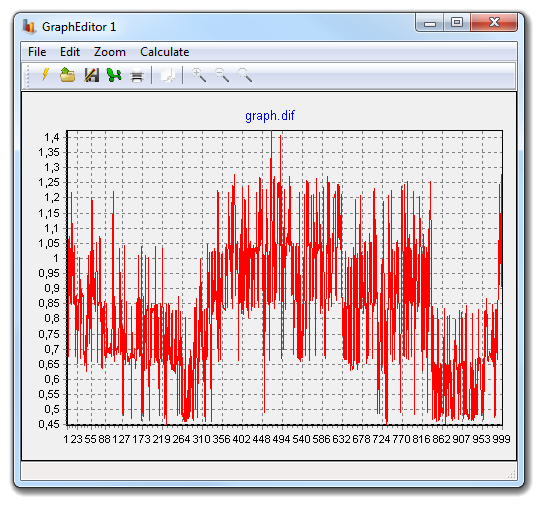
Remove the noise applying a DFT (Discrete Fourier Transformation) low-pass filter. As first step it creates the frequency spectrum, it removes the high frequencies and finally it rebuilds the filtered wave using the inverse DFT. Consider the following plot:
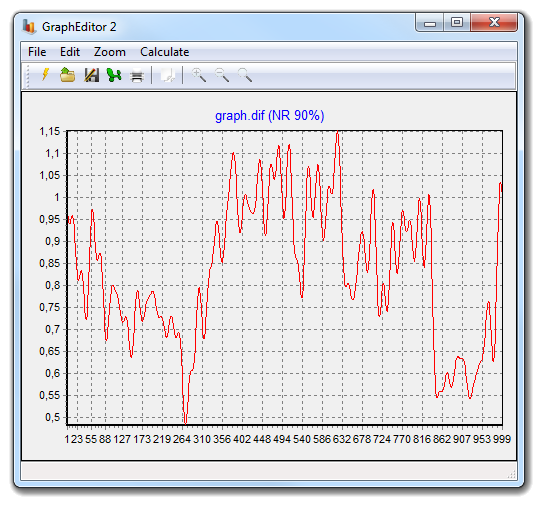
Suppose to apply the 90% noise reduction because you want consider the low frequency transitions (slow transitions):
|
| 90 | - | ||
| 75 | - | ||
| 50 | - | ||
| 25 | - | ||
| Derivative | - |
Calculate the first derivative. |
|
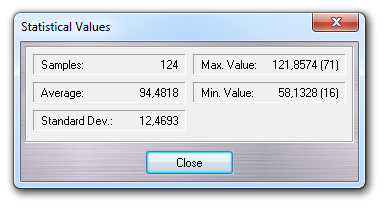
| Statistical Values | - | Show some statistical values related to the
data set:
|