8.6 Trajectory analysis
VEGA ZZ can analyze trajectory files of MD simulations, displaying the results
by a 2D/3D/4D graphical representation. To
analyze a MD trajectory, as first step, you must open the starting molecule structure, selecting the
File
![]() Open item of the main menu. Furthermore, you must open the analysis dialog, by
clicking on Calculate
Open item of the main menu. Furthermore, you must open the analysis dialog, by
clicking on Calculate
![]() Analysis and on
Analysis and on
![]() button to select the trajectory file
or dragging the file over the trajectory analysis window and dropping it. At this time,
the Accelrys archive, AutoDock 4 DLG, AutoDock Vina PDBQT multi-model, BioDock 3.0, CHARMM/NAMD .dcd (little and big endian),
CIF multi-model, ESCHER NG, Gromacs TRR. Gromacs XTC, IFF/RIFF, MDL Mol
multi-model, Tripos Mol2 multi-model, PDB
multi-model and Quanta conformational search .csr
formats are accepted and the file size limit is 16 Exabytes (17.179.869.184 Gb,
for more information see the FAQ section).
button to select the trajectory file
or dragging the file over the trajectory analysis window and dropping it. At this time,
the Accelrys archive, AutoDock 4 DLG, AutoDock Vina PDBQT multi-model, BioDock 3.0, CHARMM/NAMD .dcd (little and big endian),
CIF multi-model, ESCHER NG, Gromacs TRR. Gromacs XTC, IFF/RIFF, MDL Mol
multi-model, Tripos Mol2 multi-model, PDB
multi-model and Quanta conformational search .csr
formats are accepted and the file size limit is 16 Exabytes (17.179.869.184 Gb,
for more information see the FAQ section).
You can open a trajectory file in several ways:
Trajectory file |
 |
Operations |
| Information about the simulation |
||
| Output file Buttons
|
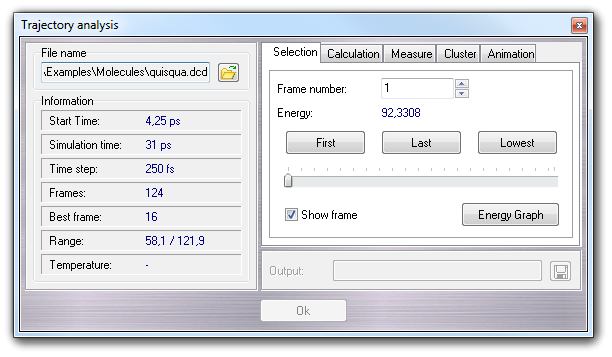
In Selection tab, you can select a specific conformation, putting the frame number or pressing First, Last and Lowest buttons (lowest means: the lowest energy conformation), or dragging the horizontal slider. The Energy Graph button opens the Graph editor showing the potential energy trace. If Show frame is checked, the frame number and the total number of frames are shown in the workspace.
Selecting this tab, you can calculate some properties for each conformation stored in the trajectory. You can show the results in the Graph editor or you can save them to an output file (Show Plot checkbox).
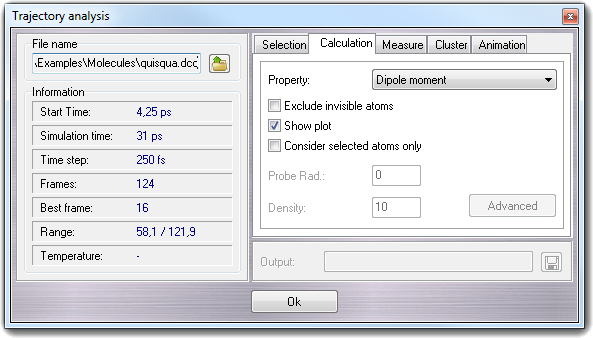
Checking Exclude invisible atoms, you can exclude the
unselected (invisible) atoms from the calculations. The invisible atoms are
totally ignored and the visible atoms are considered as a whole molecule. This
option is useful when you want to calculate the solute area in a solvent cluster:
unselecting the solvent, its contribute in the surface calculation is totally
ignored.
Checking Consider selected atoms only, you can
calculate properties considering the visible atoms only. In the case of the
surface area, the unselected (invisible) atoms are considered to compute the
overlap of the Van der Waals spheres, but not in the area evaluation. In other
words, the area obtained enabling this option is lower than the Exclude invisible atoms
because the contribution of the overlapped zones is subtracted. The Consider selected atoms only
is useful when you want calculate the surface of a protein domain or a
substructure in a generic molecule.
The calculable properties are: dipole
moment, gyration radius, molecular lypophilicity (MLP), molecular lypophilicity index
(ILM, water cluster required), lipole (Broto & Moreau), lipole (Ghoose
& Crippen), ovality, polar surface area (PSA), root mean square deviation
(RMSD, RMSD with H, RMSD alignment, RMSD alignment with H, RMSD with symmetry
correction and RMSD with symmetry correction with hydrogens), surface area, surface
diameter, volume and volume diameter (for more
information, click here). For the surface properties,
you can specify the probe radius (e.g. for the solvent accessible surface) and the dot
density; for the volume properties you can put only the dot density. Higher values of
dot density, give more precise results, but require more CPU time. Check Show plot
to show the results in Graph
editor.
The Advanced button is enabled when you select the RMSD calculation.
Clicking it, a dialog window is shown in which it's possible to change the
RMSD options:
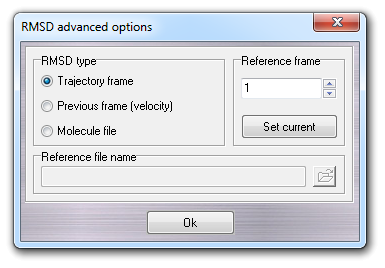
In this window, you can select the reference structure (set of coordinates) used in RMSD calculations. It can be a specific trajectory frame (default 1), the previous frame and a molecule file. Please remember that this file must be compatible with the molecule used for the molecular dynamics simulation and, in other words, it must be the same molecule. Previous frame RMSD type is useful to measure the RMSD between subsequent frames and implicitly the velocity of the molecule movements (remember that the time step is constant during the simulation).
In this tab, you can measure some geometric properties as distance, angle, torsion (dihedral angle) and angle between two planes (plane angle).
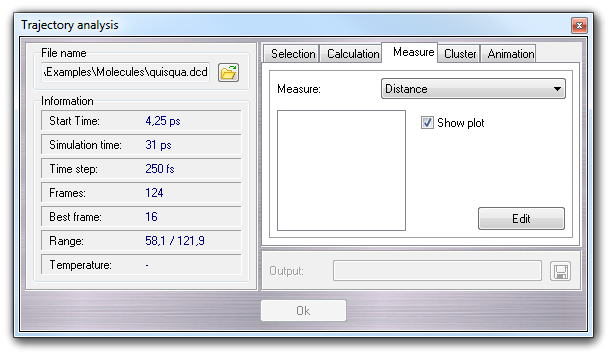
In the list box, you must choose the geometric property that must defined by Selection Tool clicking Edit. To perform the calculation, you must press Ok button.
Selecting Cluster tab, it's possible to perform the cluster analysis of the conformations on the basis of coordinates or torsions.
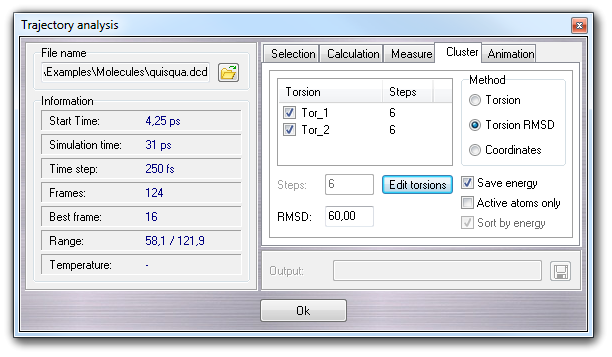
Three cluster methods are available:
Torsion, Torsion RMS and Coordinates. The first two methods
require to select torsions by Selection Tool, clicking the Edit torsion
button. The torsions are listed by
name (Torsion column) and torsion steps (Steps column) and they
can be included or excluded checking or unchecking them. The context menu allow
to un/check all torsions (Check all, Uncheck all), to un/check all
selected torsions (Check selected, Uncheck selected) and to
un/select all torsions (Select all, Unselect all). If the
clustering method is Torsion, it's possible to change the steps in which
the 360° angle is subdivided (e.g. 6 means clusters of 0, 60, 120, 180, 240, 300
degrees for each torsion angle), selecting one or more torsions in the list and
changing the value in the Steps field.
If the clustering method is Torsion RMSD or Coordinates,
RMSD field is enabled, but the meaning is much different: for the former, RMSD is the root mean square deviation in degrees
between torsion values of two conformations, and for the latter, it's the
root mean square deviation in Å between atom coordinates of two
conformations.
Checking Save energy, a .ene file in CSV format is saved using the
clustered trajectory as base name. The format of the CSV file is:
CLUSTER_NUMBER; ENERGY; CLUTERED_CONFORMATIONS; TORSTEP_1; TORSTEP_2; TORSETP_N
where:
| CLUSTER_NUMBER | Cluster number (ID) from 1 to N, where N is the total number of clusters. |
| ENERGY | Energy of the best conformer in the cluster. |
| CLUTERED_CONFORMATIONS | Number of conformations classified in the cluster. |
| TORSTEP_1 TORSTEP_2 ... TORSTEP_N |
Torsion step defining the cluster. If the torsion steps are 6, and the step of the first torsion is 0, it means that the conformation in the cluster have the first torsion in the range form 0 to 60 degrees (e.g. 3 in the 180 to 240 range). These fields are available for the Torsion method only. |
Checking Active atom only, the
active (visible) atoms only are considered in the cluster analysis and checking
Sort by energy, the resulting clusters are sorted by energy (from the lowest
to the higher).
Clicking Ok, Save trajectory
file requester is shown in which it's possible to change the name and the format
of the clustered trajectory.
WARNING:
It's impossible to perform the cluster analysis if each conformation has a
unknown energy. It means that you must have a file containing
the energies (e.g. the .ene file generated by the AMMP conformational search,
the NAMD output file, etc). Quanta/CHARMM .csr format is the only one that contains the
energies of each conformation.
If the energies are inaccessible, the Ok button is disabled.
This tab controls the molecule animation based on the trajectory file.
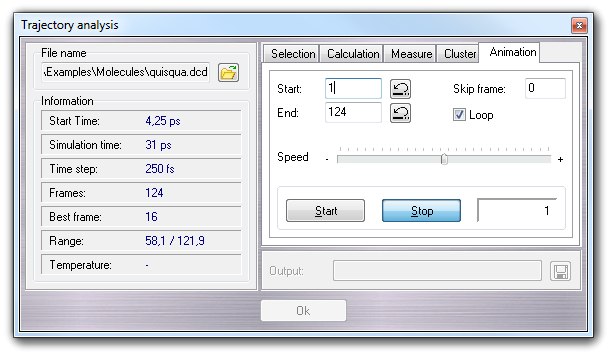
You can Start and Stop the
animation, change the animation Speed, Skip Frames, activate the
animation Loop, set the Start and the End of the animation.
Press the
![]() button to jump
at the beginning or at the end of the trajectory.
button to jump
at the beginning or at the end of the trajectory.